Interactive Feature Tour
Welcome to the ERGY product tour!
This section helps you browse and understand all the features ERGY has to offer, so you can choose the product that’s right for you.
Click on any outlined section for a full description of the feature, and look for the Lite, Basic and Plus logo to see which versions of ERGY have it.
From the feature window use the “Previous” and “Next” buttons to browse several features quickly.
Click here to upgrade to ERGY Basic or ERGY Plus.
Found in all ERGY versions:
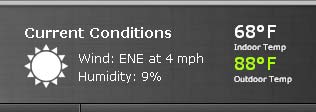
The Current Conditions section combines your local weather with a color-coded temperature comparison to let you know how hard your HVAC system needs to work to keep up with Mother Nature.

Found exclusively in the version
The Display As feature let's you choose how you'd like to see your data so you can understand your consumption in terms you already know.
- Click the lightning bolt to view your consumption in Watts and KiloWatt-Hours
- Click the dollar sign to have ERGY translate your consumption into real-time spending, showing exactly what each device costs to use.
- Click the cloud to have ERGY measure your consumption in terms of your CO2 emmisions.
Found in all ERGY versions:
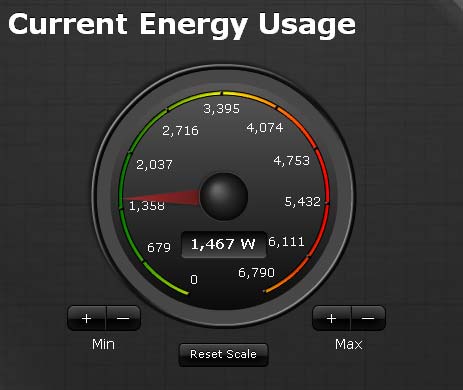
- The current Energy Usage section shows your real-time energy usage at a glance. Easily check the latest reading from your whole-house meter. Don't have one? No problem, ERGY will display the total usage of all your energy-related devices.
- ERGY will automatically scale your gauge based on your usage, but if you'd like to customize it, use the Min and Max feature to dial in the range that works for you. Use the Reset Scale button to go back to ERGY's default range.
Found in ERGY versions:
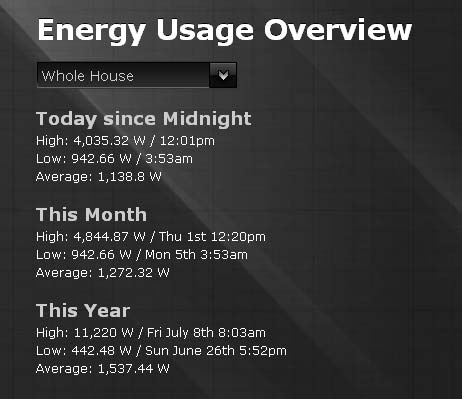
Select from either the whole house or an individual device to see its high, low and average power use for the day, month and year.
Found in all ERGY versions:
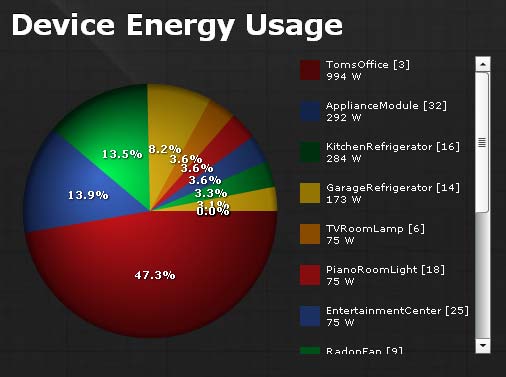
Interactive pie chart: easily see how much power your devices are using in relation to each other.
Found in ERGY versions:
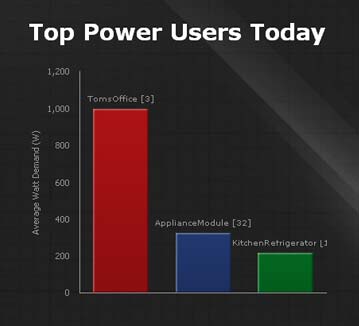
Easily see the three devices using the most energy today.

Found in ERGY versions:
Multiple time ranges allow you to easily scale the graph.
Display your total energy use over multiple time scales to compare hourly, daily and monthly totals.

Found in all ERGY versions:
View your total energy usage over time to reveal events or trends.

Found exclusively in the version
Export your daily, weekly, monthly, and yearly energy totals to downloadable CSV and manipulate your data as you wish.

Found exclusively in the version
View your total energy usage over time along with indoor and outdoor temperature to reveal events or trends.
Found exclusively in the version
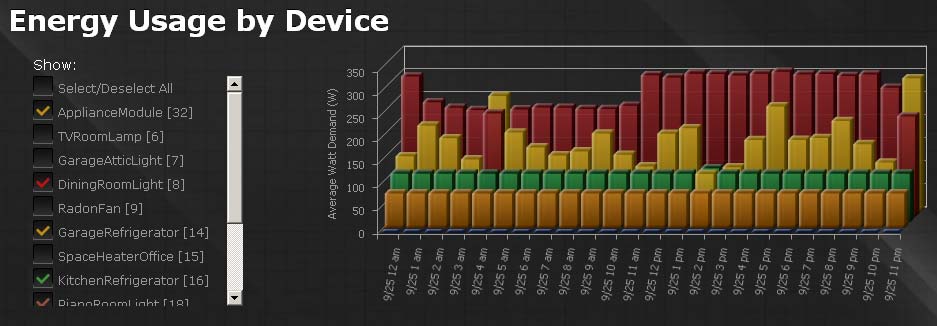
View and compare individual device energy usage over time to reveal events or trends. Toggle devices on and off to customize your comparison.
Found exclusively in the version
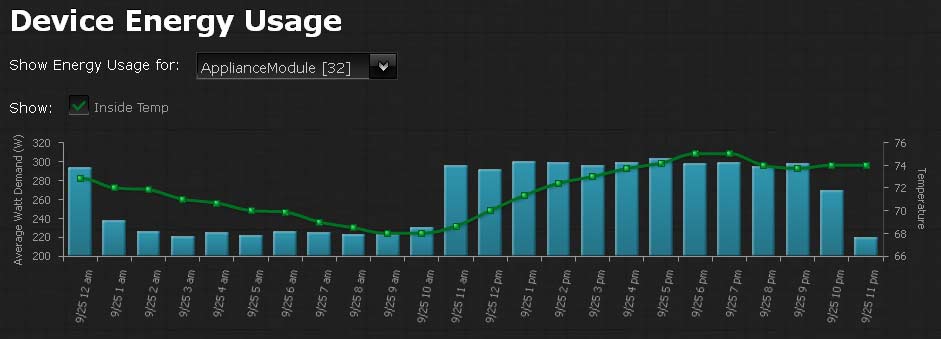
Isolate the view of one device's total energy usage over time along with indoor and outdoor temperature to reveal events or trends.

Found exclusively in the version
Track your renewable energy investment by viewing your total energy production over time. Overlay indoor and outdoor temperature to help reveal efficiency trends.
Found exclusively in the version
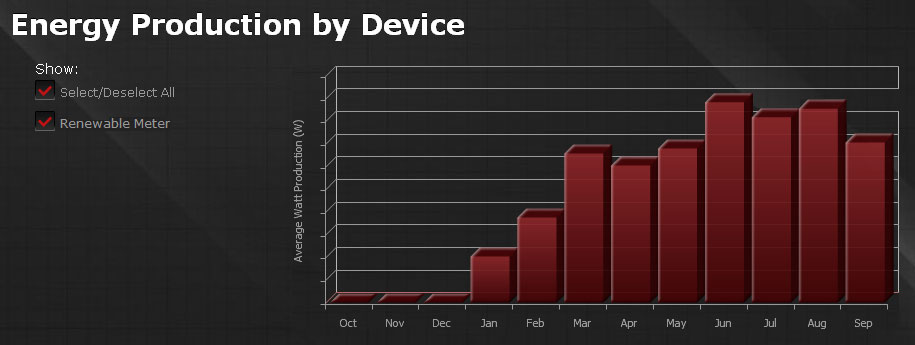
Compare individual device energy production over time and track your renewable energy investment. Toggle devices on and off to customize your comparison.
Found exclusively in the version
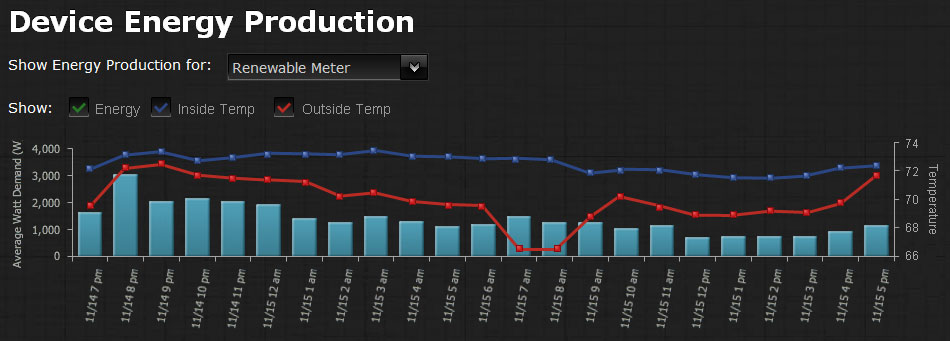
Isolate the view of one device's total energy production over time along with indoor and outdoor temperature to help reveal efficiency trends.